Each line on this chart represents one year of births in Suffolk County (Long Island), NY, an area hit particularly hard by Sandy. The line for 2013 (the year following Hurricane Sandy) is blue. The purple dots fall approximately 9 months after Hurricane Sandy swept the area. If Hurricane Sandy correlated with a mini baby boom, we'd expect to see an increase in births around June or July 2013.
While there does appear to be a small increase in births from June to July, that seems to be a consistent yearly trend in Suffolk County. In fact, if we look only at June and July births, we'll see that 2013 falls in the middle of a period of low births in the area, with no apparent baby boom in sight.
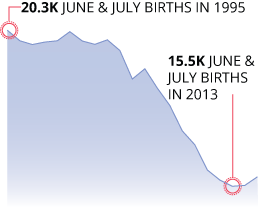
June and July births in Suffolk County, NY
This is not conclusive proof that Sandy had no effect births. A potential increase could have been offset by the millions of other factors that impact the reproductive decisions of Sulfolk county residents.
That said, we can look for baby booms, and so far we’re not seeing any.
Sports Babies?
If anything can bring people together, it's shared joy over an epic win by your favorite team, right? For the Boston Red Sox, few wins were quite as big as their 2004 World Series victory, their first title since 1918. Let's look at Boston births in 2005.
Once again, there's no apparent baby boom. And in this case, July of 2005 (just about 9 months after the win) saw the fewest summer Boston babies of all 21 years.
Post-Terrorism Babies?
Perhaps instead of celebration or a lack of electricity, it's a sense of shared fear and mortality that causes a rise in births. Let's look at Oklahoma City following the 1995 bombing.
Nine months after the attack, Oklahoma City was looking at their lowest number of January births in all 21 years.
Bankruptcy Babies?
Since having children is an inherently expensive commitment, it's possible that an economic downturn in your city could make you re-evaluate your choice to reproduce. For instance, in 2013, the city of Detroit filed for bankruptcy.
There doesn't seem to be a dramatic decrease in births immediately following the formal bankruptcy in Detroit. However, annual births in the city have declined about 30% since 1995, suggesting that economic turmoil may have a more long-term effect. A study of the recent European recession found a “consistent negative impact of unemployment on fertility rates” with “the greatest impact found at younger ages.” (who can easily adjust family planning).
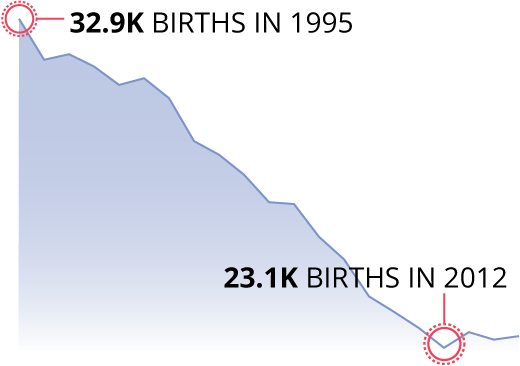
Annual Births in Wayne County, MI
For comparison, the population in Wayne County (where Detroit is located) decreased about 15% in that same time, and the national birth count increased about 1%.
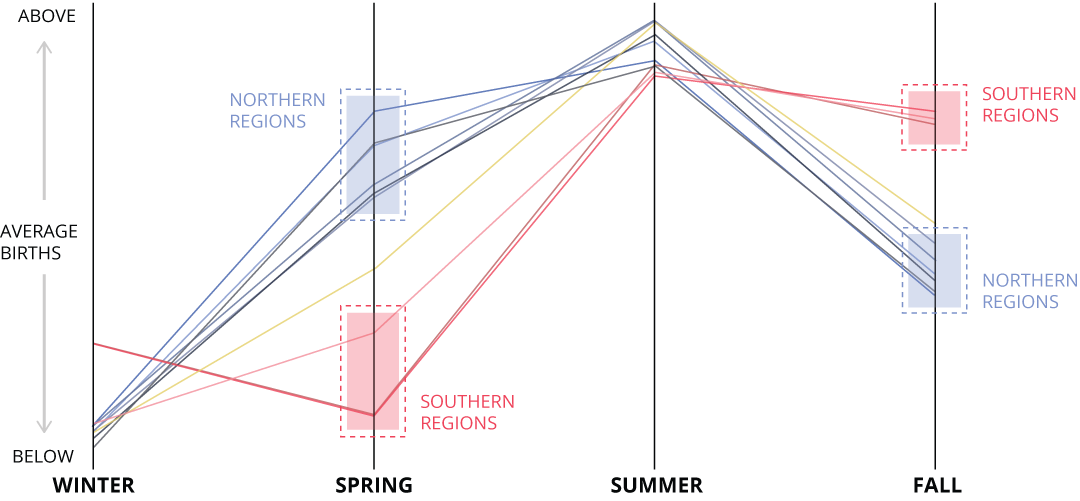
Seasonal Babies?
Apart from specific events, researchers suspect that the timing of births may be seasonal. To look for seasonal trends, we'll combine each of our 21 lines into one representing the average number of births per month. The shaded area surrounding the line represents the variation* in that average across 21 years.
* Methodology Note: The solid line represents the median number of births per month and the upper and lower edges of the shaded area represent the upper and lower quartiles of the data. Think of this as a series of box plots connected together.
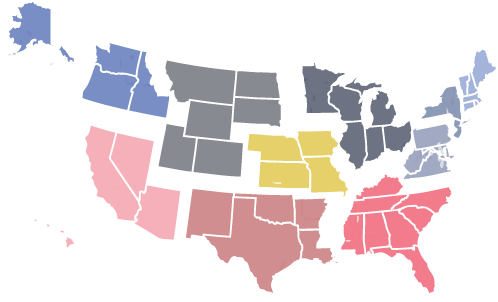
While seasonal trends are harder to spot in counties with relatively small populations, they're more noticeable on the state level. For instance, let's look at Florida. Every year, the Sunshine State sees its biggest spike in births in the late summer and early fall. That places the highest conception time for Floridians around October through February.
The pattern of few spring time babies and lots of late-summer babies is common in the southern states, but is less pronounced in the northern states. Let's look at Maine. That spring time dip virtually disappears, with birth counts remaining relatively consistent throughout the spring and summer. This places the largest number of Maine conceptions in August to December.