Loading data...Please do not scroll yet!
In this article, we focus only on the House of Representatives.
Let's start by introducing the visualization format. Each gray bar represents a presidential term.
For example, this bar represents Franklin D. Roosevelt's term.
Let's draw a line for each woman who has served in the House of Representatives. For example, this line is for the longest-serving woman House Member, Democrat Marcy Kaptur, who represents Ohio's 9th District.
Here are all the women who have served in the House of Representatives. Democrats and Republicans are represented by their usual colors. Let's look at a few prominent women.
Jeannette Rankin
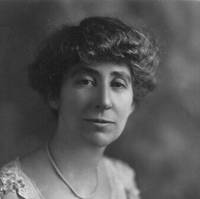
1917 → 1919
Montana's at-large
Republican Jeannette Rankin was the first woman to be elected to national office. She first rose to prominence as a campaigner for women's suffrage in Montana, and in 1916 she won one of Montana's two "at-large" House seats. While she lost the next election due to a change in the state's electoral rules, she returned to the House in 1941. A lifelong pacifist, Rankin voted against the United States' engagement in both world wars. She is the only woman elected to Congress from Montana.

Patsy Mink

1965 → 1971
Hawaii's at-large
Patsy Matsu Takemoto Mink (竹本 まつ), a liberal Democrat from Hawaii, was the first woman of color to be elected to Congress. She served 12 terms in the House of Representatives, was an early critic of the Vietnam war, and fought for causes such as women's rights, labor unions, and civil liberties. She famously co-authored Title IX, a civil rights law that promoted gender equality in education.

Shirley Chisholm
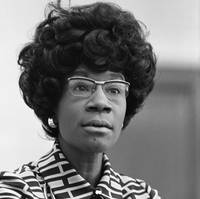
1969 → 1983
New York's 12th
Shirley Chisholm became, in 1968, the first black woman elected to Congress, and in 1972, the first woman to run for the Democratic Party's presidential nomination. She famously said, “I ran because somebody had to do it first,” after earning 152 delegates at the national convention. While in Congress, she was an unabashed supporter of her constituents in Brooklyn, NY, championing daycare funding, minimum wages, and gender equality.
Presently, 89 women serve in the House, making
up 20% of representatives.
The House is still a long way from gender parity. For every woman currently serving in the House, there are nearly 4 men.
The breakdown also varies by party. In 2018, 33% of Democratic House members are women.
On the other hand, only 10% of current Republicans in the House are women.
While approximately a fifth of the House is women, it’s important to place the imbalance in context of other countries. Is the US progressive, or does it pale in comparison to other governments in gender representation?
Visualized is the percent of women elected to in other national government bodies (among OECD member countries). In Norway, this is the Stortinget. In Mexico, it’s the Cámara de Diputados. For the United Kingdom, it’s the House of Commons.
The Nordic countries lead in equal gender representation, although Mexico has also made great strides. Many of these countries, such as Norway, Sweden, and Mexico have also implemented gender quotas to improve representation, although Iceland, notably, has not. None of these countries have made it to gender parity. In fact, the only two countries in the world to meet or exceed 50% women in governing bodies are Bolivia and Rwanda (not visualized here), both of which also have gender quotas.
The US, on the other hand, ranks 28th out of 34.
With gender parity, constituents might hope that elected officials focus on more inclusive issues (as, for example, Patsy Mink did with Title IX legislation). To better understand how a gender shift in the House might affect the topics debated by our representatives, consider the speeches made by House members.
From the Congressional Record, we compiled a collection of 500,000 speeches delivered by men and women in the House from 1994 to the present, including monologues, debates, single-sentence replies, and even acknowledgments praising particular individuals.
We then used a probabilistic machine learning model1While there are a number of different machine learning techniques that can do this, including neural networks, the beauty of Latent Dirichlet Allocation (LDA) is that it is an unsupervised learning algorithm. Unlike most other algorithms, it does not require pre-labeled speeches to train the model, which would bias the inference process by selecting the topics in advance. The only necessary inputs are the corpus of speeches and a rough guess of the total number of topics within the corpus. to help us infer the topics within a speech, looking for words that often appear together and clustering them into the same group2For example, suppose we choose a small number of topics (e.g., 10), the model will identify the 10 most overarching themes in congressional speeches. We wanted to identify more subtle topics and themes, and after a bit of experimentation, we settled on 75 topics. As is often the case with LDA models, many of the topics identified were nonsensical, but the majority were well-defined. (eg. energy policy, jobs, economy, taxes, health care, etc.)
3LDA does not output these names. Rather, it gives us a list of words and phrases that are most closely associated with a particular topic.
Suppose we had two topics:
We label Topic 1 as “energy policy” and Topic 2 as “natural disasters.”
For example, if we input the sentence “Wind and solar power are renewable energy sources while natural gas is a fossil fuel,” the model outputs that it is 84% about the “energy policy” topic whereas “There is a lot of natural gas in the Middle East” is only 46% about “energy policy”. Speeches can also include multiple topics.
Suppose we had two topics:
| Topic 1 | Topic 2 |
|---|---|
| energy | disaster |
| oil | hurricane |
| natural gas | fema |
| coal | emergency |
| electricity | hurricane katrina |
| renewable energy | natural disaster |
| pipeline | orleans |
| global warming | earthquake |
For example, if we input the sentence “Wind and solar power are renewable energy sources while natural gas is a fossil fuel,” the model outputs that it is 84% about the “energy policy” topic whereas “There is a lot of natural gas in the Middle East” is only 46% about “energy policy”. Speeches can also include multiple topics.
The result: a rough calculation for the fraction of time each representative has spent on an issue.
Here is the topic “energy policy”. Each circle in this chart represents a particular House member: men on the left and women on the right. The higher the circle, the greater the proportion of their time in the House was spent talking about energy policy.
We can represent the difference between the median amount spent by men versus women with a line.
Men and women representatives appear to devote roughly the same amount of their speeches to energy policy. Next, let’s examine another topic, one on which women focus more than men: “healthcare”.
While healthcare is an important topic for all representatives, women spent more than twice the amount of their speeches discussing healthcare and medical issues than men.
Even when accounting for party, the result is almost exactly the same: Republican women are just as far apart from Republican men as Democratic women are from Democratic men1View the breakdown by party here..
Now let's examine a topic favored by men: “government budget”
With the government budget, men spent a greater portion of their speeches on budget and taxes in comparison to women (although the difference isn't as extreme as with healthcare).
Let's take the median difference between men and women for government budget (depicted as a line) and plot it against all other topics.
A difference of +100% (e.g., as is the case with “child welfare”) means that women are twice as likely as men to refer to the topic in a speech. A difference of -100% means the opposite: men are twice as likely as women to refer to the topic.
Women representatives focus more of their speeches on healthcare, civil rights, labor rights and the environment.
Men focus more of their speeches on the military, agriculture, and the budget.
Select a topic to examine its data more closely.
In the upcoming 2018 midterm elections, a record number of women have filed to (or are planning to) run for a House seat (as of June 2018) and there is still time to file. Democratic women candidates in particular are running in record numbers, but Republican women candidates are also on the rise. The outcome has the potential to dramatically shift the gender breakdown of the House.