
Introduction
Every so often, readers email us asking how they can gain the skills necessary to create the sorts of data-driven, visually essays that we publish on The Pudding. The deficit in clear guides to becoming visual journalists is understandable: this form of storytelling has only recently begun to gather momentum, and unlike traditional essay-writing, reporting, or editorial work, has neither a well-defined form, nor a formalized set of tools. Moreover, resources for those willing to learn are fragmented, tending to focus exclusively on data analysis, or solely dealing with data visualization, making it difficult to find a comprehensive and unified guide.
There is, however, a broader issue at play: we have a curious tendency of assuming that people who can do certain things that we cannot are imbued with superior innate talents (if you’d like to hear more about this in the context of programming, I’d recommend this talk on experts and beginners by Jacob Kaplan-Moss, or this heartening talk by Julia Evans). This may be especially common for the sort of code-driven interactive data visualizations which we work on, since they rely on an odd grab-bag of skills —critical thought, design, writing, and programming — that people in many other professions may have neither a full awareness of, nor full expertise in.
In this series of blog posts, I’ll attempt to present a clear, non-technical introduction to the tools used in visual, data-driven storytelling, and provide you with a map to the field’s general landscape — reading this should give you a sense of how we work, and where you can turn to hone your skills to start working on visualizations like ours. More broadly, however, I’m hoping that my putting this guide together will help remove some of the unnecessary mystique surrounding data viz, and demonstrate that the only things that separate a beginner from a speaker on the conference circuit time and practice.
The Pudding workflow
Members of the Polygraph team have vastly different backgrounds, which include business, computers science, psychology, marine biology, and journalism. Consequently, we’ve all picked up our data skills in myriad ways. While each of us has some manner of specialty or preference, we are, broadly, generalists, each of whom uses a general purpose programming language, some combination of data analysis tools, and JavaScript for web programming and data visualization.
In addition to a common purpose, these tools share something else: they’re all free. While there are many proprietary programs and software packages for data and visualization-related work, our team relies exclusively on open-source tools that anyone can use. In addition to focusing on these tools because they are currently the industry-standard, I’m also hoping to show that the largest barrier to entry into the data-visualization/storytelling world are time and persistence, rather than tool cost.
Broadly, the three components of our work are:
- Data
- Visualization
- Writing
This first blog post is dedicated to data.
Getting comfortable with programming
Newcomers to programming often wonder what the best language to learn is, and the answer largely depends on what you’d like to do.
I’m heavily in favor of learning Python for data work, since Python syntax is relatively easy to understand for beginners, and has a plethora of fantastic pre-written content (generally referred to as libraries) that you can seamless incorporate into your code to get around nearly any data issue.
Beginning with Python has another advantage: the basics you’ll learn here will prove invaluable when it comes to compiling data sets and coding actual visualizations. Having said this, however, it’s worth mentioning that others on the Pudding team lean towards other tools: Russell prefers using JavaScript/Node for data processing, while Amber’s tool of choice is R, a language whose roots lie at Bell Labs, where its predecessor was first created with data analysis in mind; Matt, meanwhile, is a strong proponent of using MySQL for high-level number crunching.
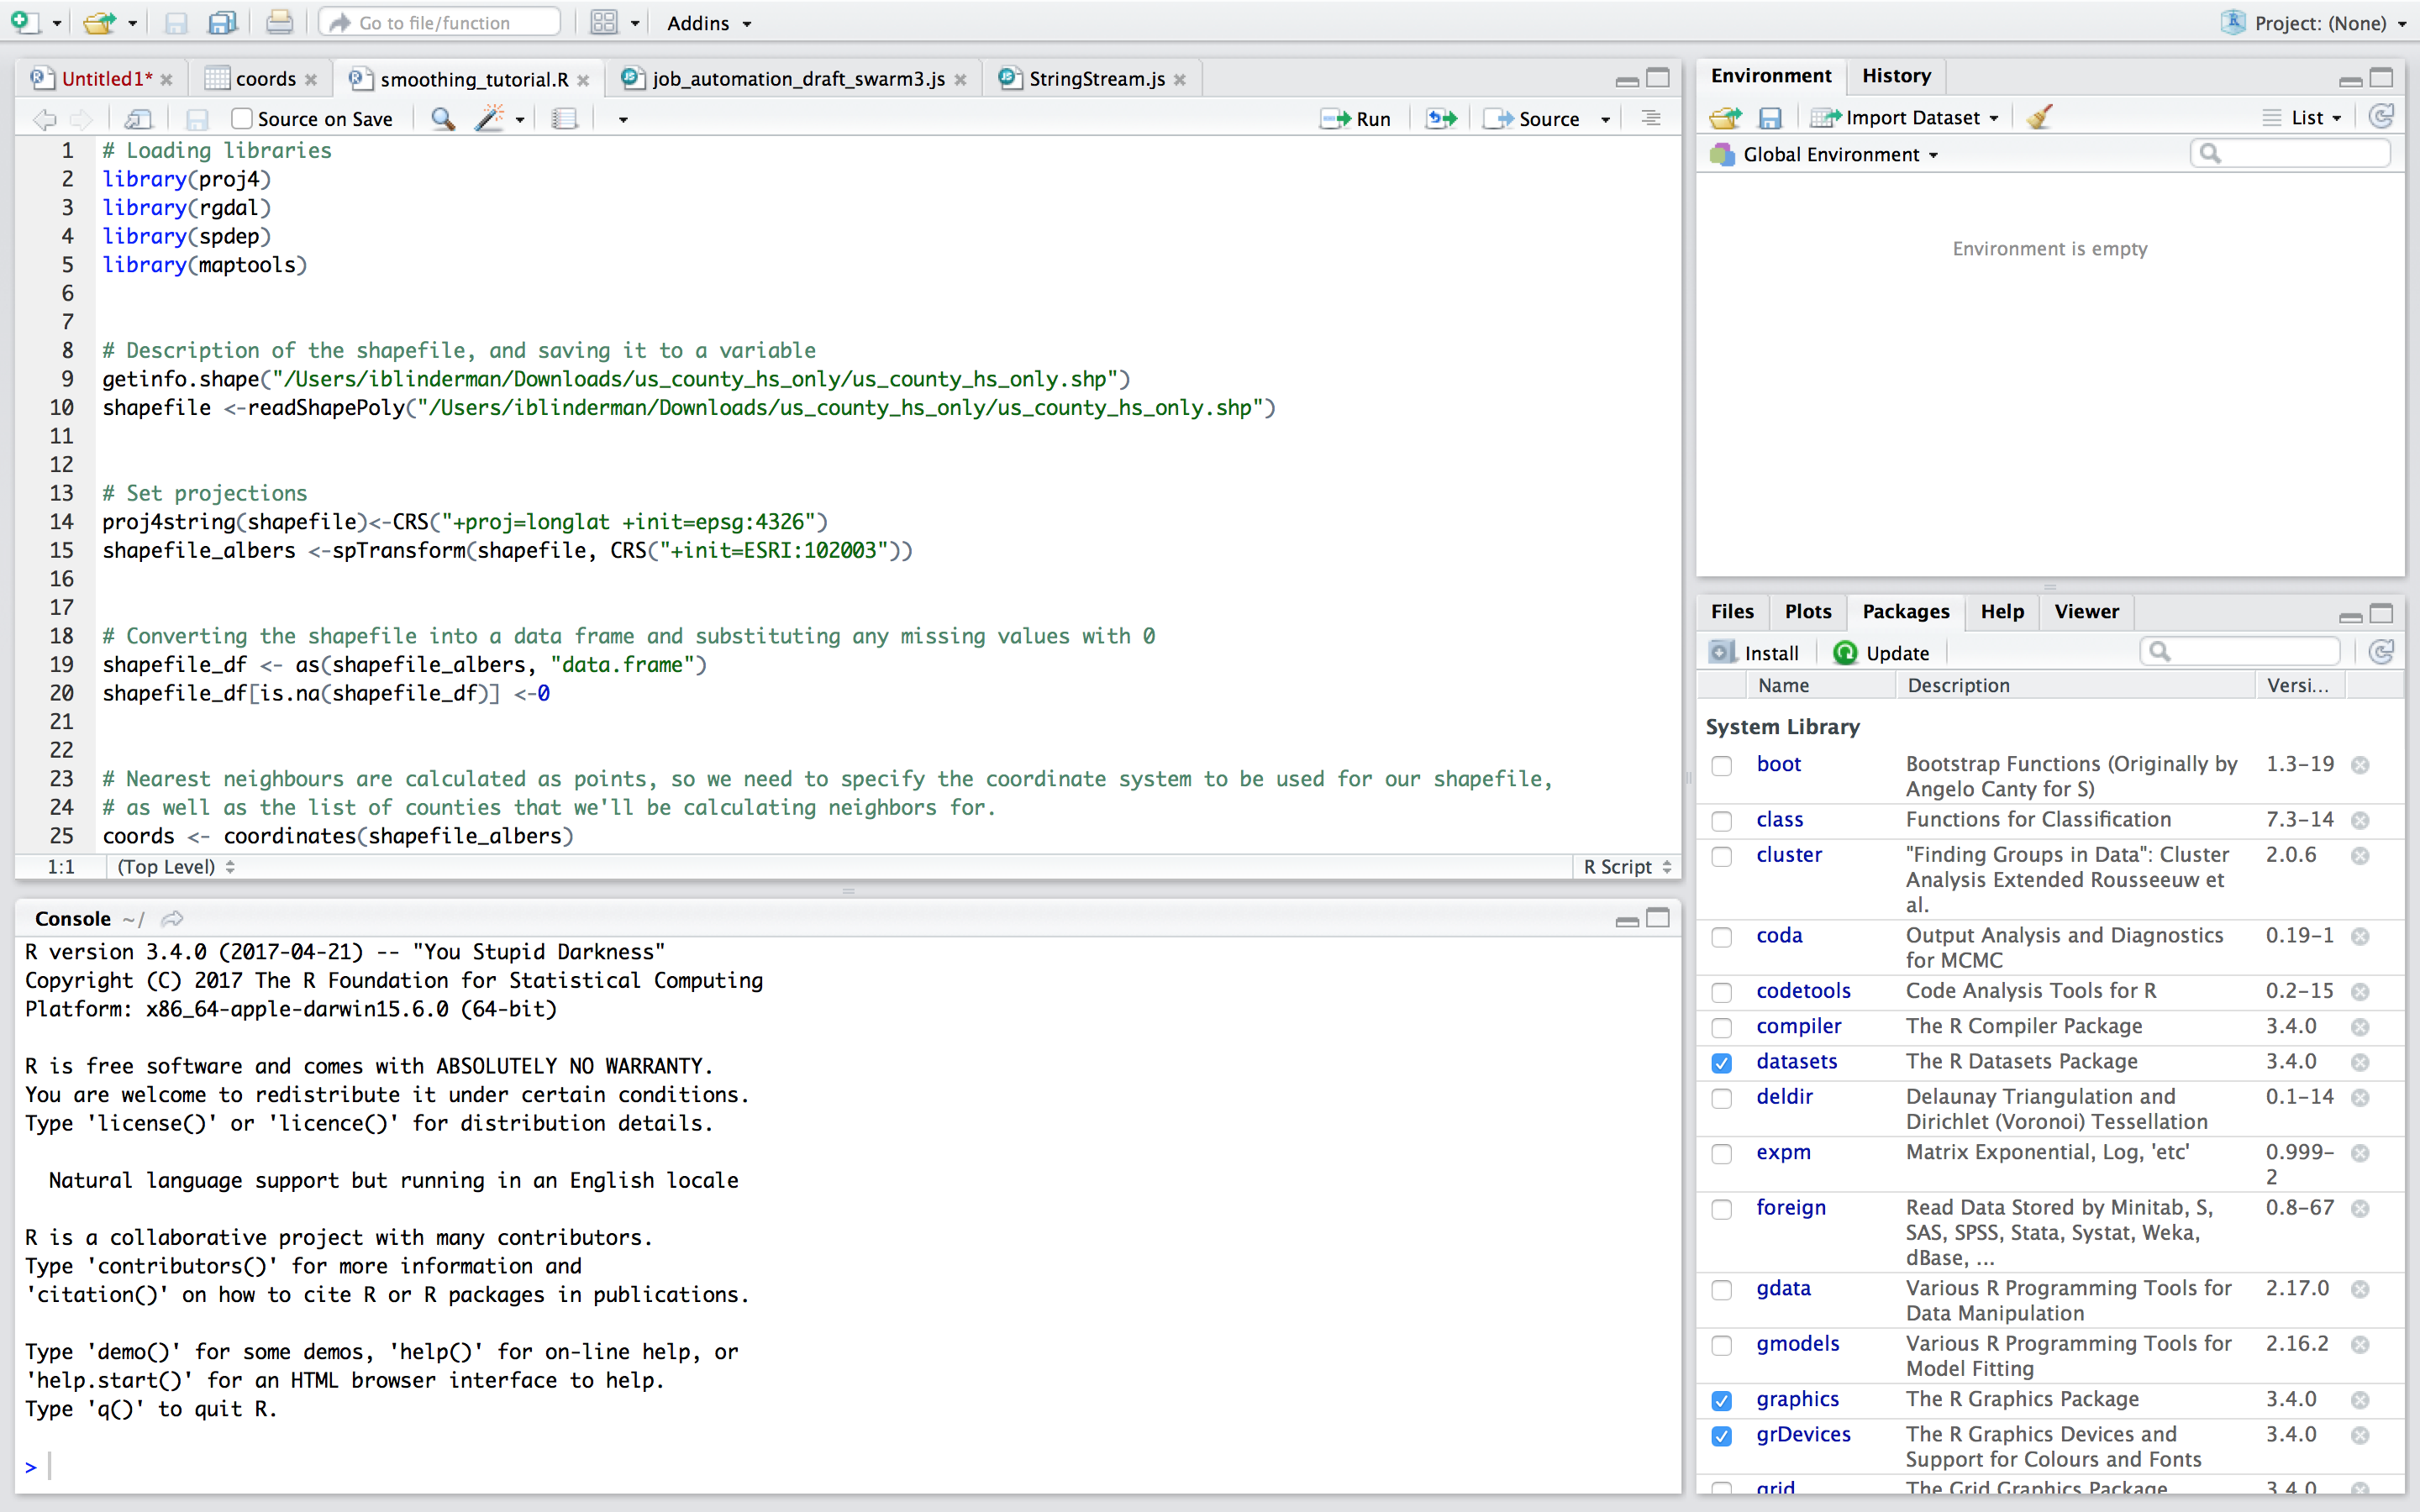
My take on these options is that JavaScript is a fantastic tool, and the more you familiarize yourself with its concepts and quirks, the easier it’ll be to create interactive data-driven visualizations on the web. R tends to shine when it comes to data analysis and mocking up/creating static visualizations; it also has a terrific user interface (RStudio). I’ve nevertheless personally found it less versatile than Python for some non-standard tasks (e.g., tricky string manipulation, web scraping, etc.), and noticed that it tends to struggle with large datasets when using the standard RStudio interface. MySQL, meanwhile, has a relatively gentle learning curve and will allow you to analyze data sets fairly quickly after trying your hand at programming, but isn’t a general-purpose programming language (i.e., it won’t allow you to scrape data and is quite limited in terms of more advanced analyses). Frankly, you can even use Excel (paid) or Google Sheets (free) to run basic analyses; I use a mix of R, Python, MySQL, and spreadsheets, depending on the task at hand.
If you’d like to begin with any of these tools, here are a few links to get you started:
R
- DataCamp’s Introduction to R
- ComputerWorld ’s Learn R For Beginners PDF (free, but requires registration)
MySQL
- Learning about MySQL and query basics at SQLZoo (I’d suggest running through this first to understand how MySQL works)
- Setting up SequelPro and MAMP (this is how most of the team uses MySQL)
JavaScript
Python
Since Python is my personal favorite, I’ll provide a more expansive set of resources to get you started below.
First, to get a sense of how Python works, I’d suggest running through several exercises that explain programming. Don’t worry — I realize that approaching the whole concept of programming is daunting, especially on your own, but by this point, the virtual fabric of the internet is literally (figuratively) bursting with great resources.
Before you start, I’d suggest setting up the Jupyter notebook environment using Anaconda (don’t worry about these names — all you need to remember is that Anaconda makes installing things a breeze). While you’d normally be able to write code and run your programs through the terminal — a text-based interface for your computer — notebooks provide a more intuitive, user-friendly interface, as well as an easier sense of the programming you’re doing, and an avenue to quickly edit and annotate your code. If you’ve never used terminal, I’d suggest checking out this brief video tutorial to help familiarize yourself with working in a text-based environment.
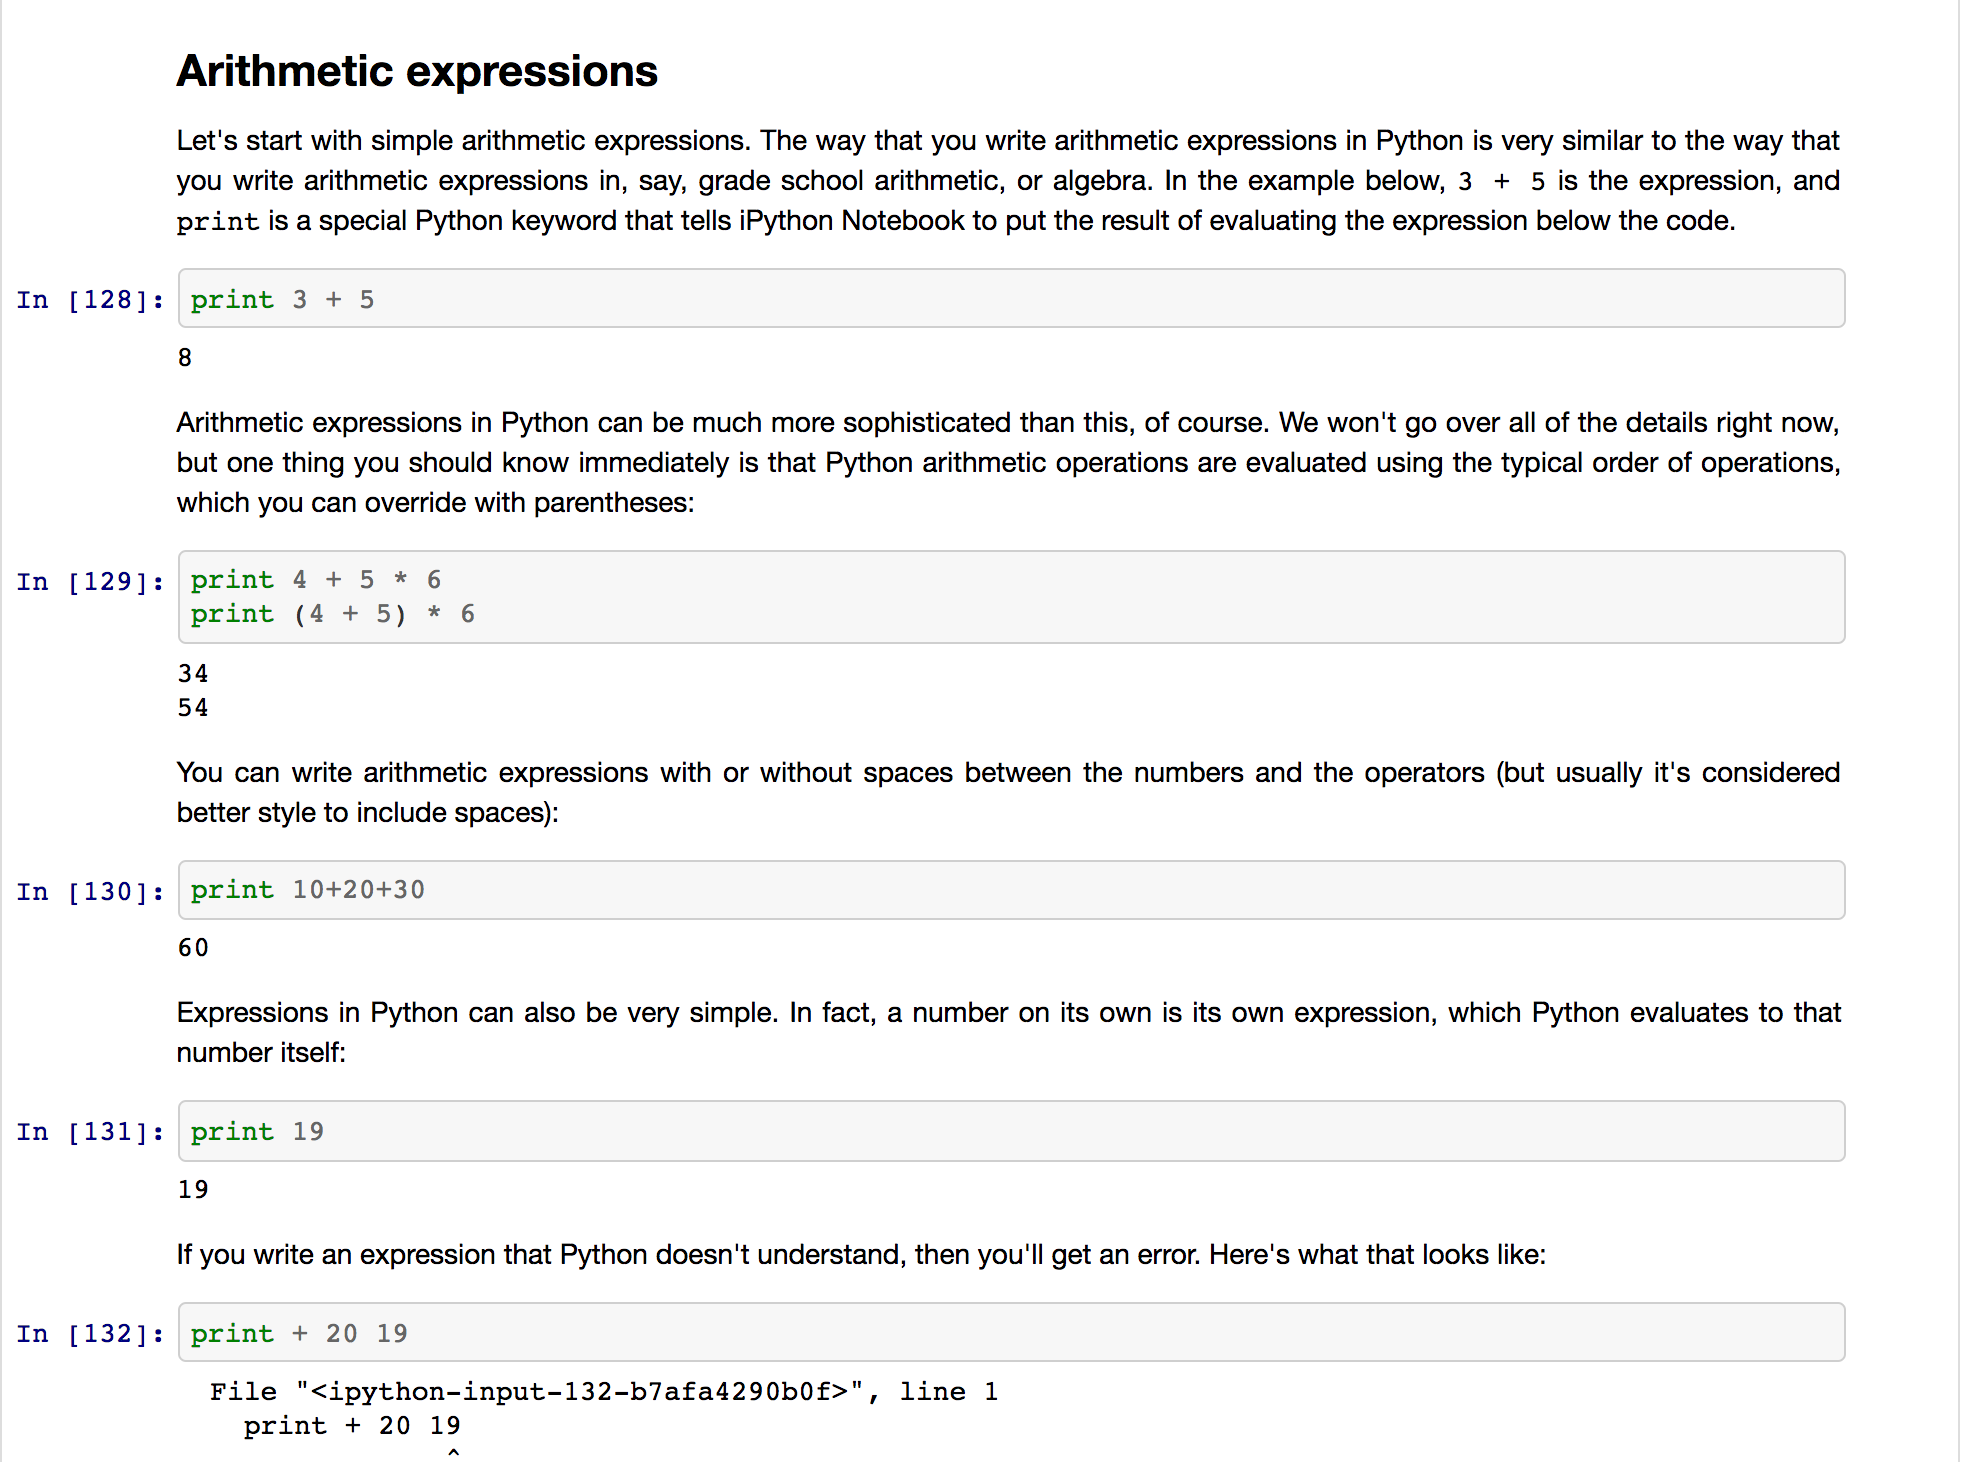
Next, let’s move on to programming: the following three lectures on Python — Lists, Dictionaries and Web APIs, Strings and Regular Expressions — from Columbia’s Lede Program (full disclosure: I’m an alum) are great starting points which I relied on to get a grasp of basic programming concepts like lists (also called arrays), loops, if statements, return statements, print statements, objects (also called dictionaries), strings, integers, and floats.
Once you’ve started to familiarize yourself with programming, my suggestion is to run through My First Python Notebook, which is, hands-down, the single best resource for programming beginners interested in data-work that I’ve encountered outside a classroom (a public shoutout to the admirable thorough Ben Welsh of the LA Times Data Desk for compiling it). Welsh does a fantastic job of keeping the technical jargon to a minimum while showing you the some of the breadth of analyses that you’ll be capable of running, and packages this primer into 16 neat, code-video pairings. Remarkably, this series was also updated in May of 2017 (it’s early August 2017 as I write); finding updated resources online can be difficult, especially for beginner resources, so I’m doubly grateful to Ben for compiling this guide.
It’s worth noting here that this first stage of data-work can be somewhat vexing: computers are great, but they’re also incredibly frustrating when they don’t do what you’d like them to do. That’s why it’s important to remember that you don’t need to worry — learning to program is exactly as infuriating and as dispiriting for you as it is for everyone else. I know this all too well: some people seem to be terrific at it without putting in all that much effort; then there was me, who first began writing code in 2014, and couldn’t understand the difference between a return statement and a print statement. The reason learning to code is so maddening is because it doesn’t merely involve learning a set number of commands, but a way of thinking. Remember that, and know that the little victories you amass when you finally run your loop correctly or manage to solve a particular data problem all combine to form that deeper understanding.
The most important skill to develop at this point is a comfort with saying “I don’t know how to do this, please help!” and framing your questions in the right way. StackOverflow ( here’s a primer to give you a sense of its importance in the programming community), the forum where programmers ask each other for help and advice, is the single greatest source you can consult. While some users can seem like they’re nitpicking, the whole of the community is willing to go to tremendous lengths to help each other out. If other users downvote your questions at first, know that this is normal, and much the same thing happened to most of us when we were starting out. Just remember: we’ve all eaten the same shit sandwich when we were starting out. Struggling in the first few weeks is just the price of admission.
Summary
- Get a basic sense of programming (my vote goes to Python or JavaScript).
- Be intimidated, feel like it sucks, and power through it.
- Don’t be afraid to ask people who are more experienced — they’ll gladly help if they see you’re putting in the effort.