“I don’t think you’d be the same person had we stayed in L.A.,” my mom told me recently. “I wanted you to have better opportunities.”
About a year ago, I moved back to my birthplace, Los Angeles. The move came after six years on the east coast and a desire to be closer to my family.
It’s weird coming back to a place so familiar yet foreign. Despite being born in L.A., and raised just south of the city, I moved to the San Francisco Bay Area when I was 7, rendering Los Angeles a relic of my childhood, a menagerie of foggy memories.
It’s unclear what my mom meant by “better opportunities.” Still, I got the gist that it was about the socioeconomic measures think tanks, policymakers and researchers use to measure progress: education, housing and income.
I thought, “can I actually measure if moving made a difference?” Indeed, your environment impacts your future outcomes, but to what extent?
In March of 2018, Raj Chetty, an economist at Harvard, and a team of researchers sought to estimate upward mobility across socioeconomic lines. Using anonymized Census data and tax records of roughly 20 million Americans, he and his team predicted outcomes for children born between 1978 and 1983 to when they were in their 30s (around 2015).
Among Chetty et al.’s findings was the importance of geographical location.
Research showed that outcomes for children could vary widely even when their neighborhoods were as little as a mile apart. Furthermore, the age at which someone moves profoundly impacts their future earnings but only up until a limit.
I was born in 1989, so I was curious—what were my expected outcomes at birth? And, what would’ve happened had I been born somewhere else?
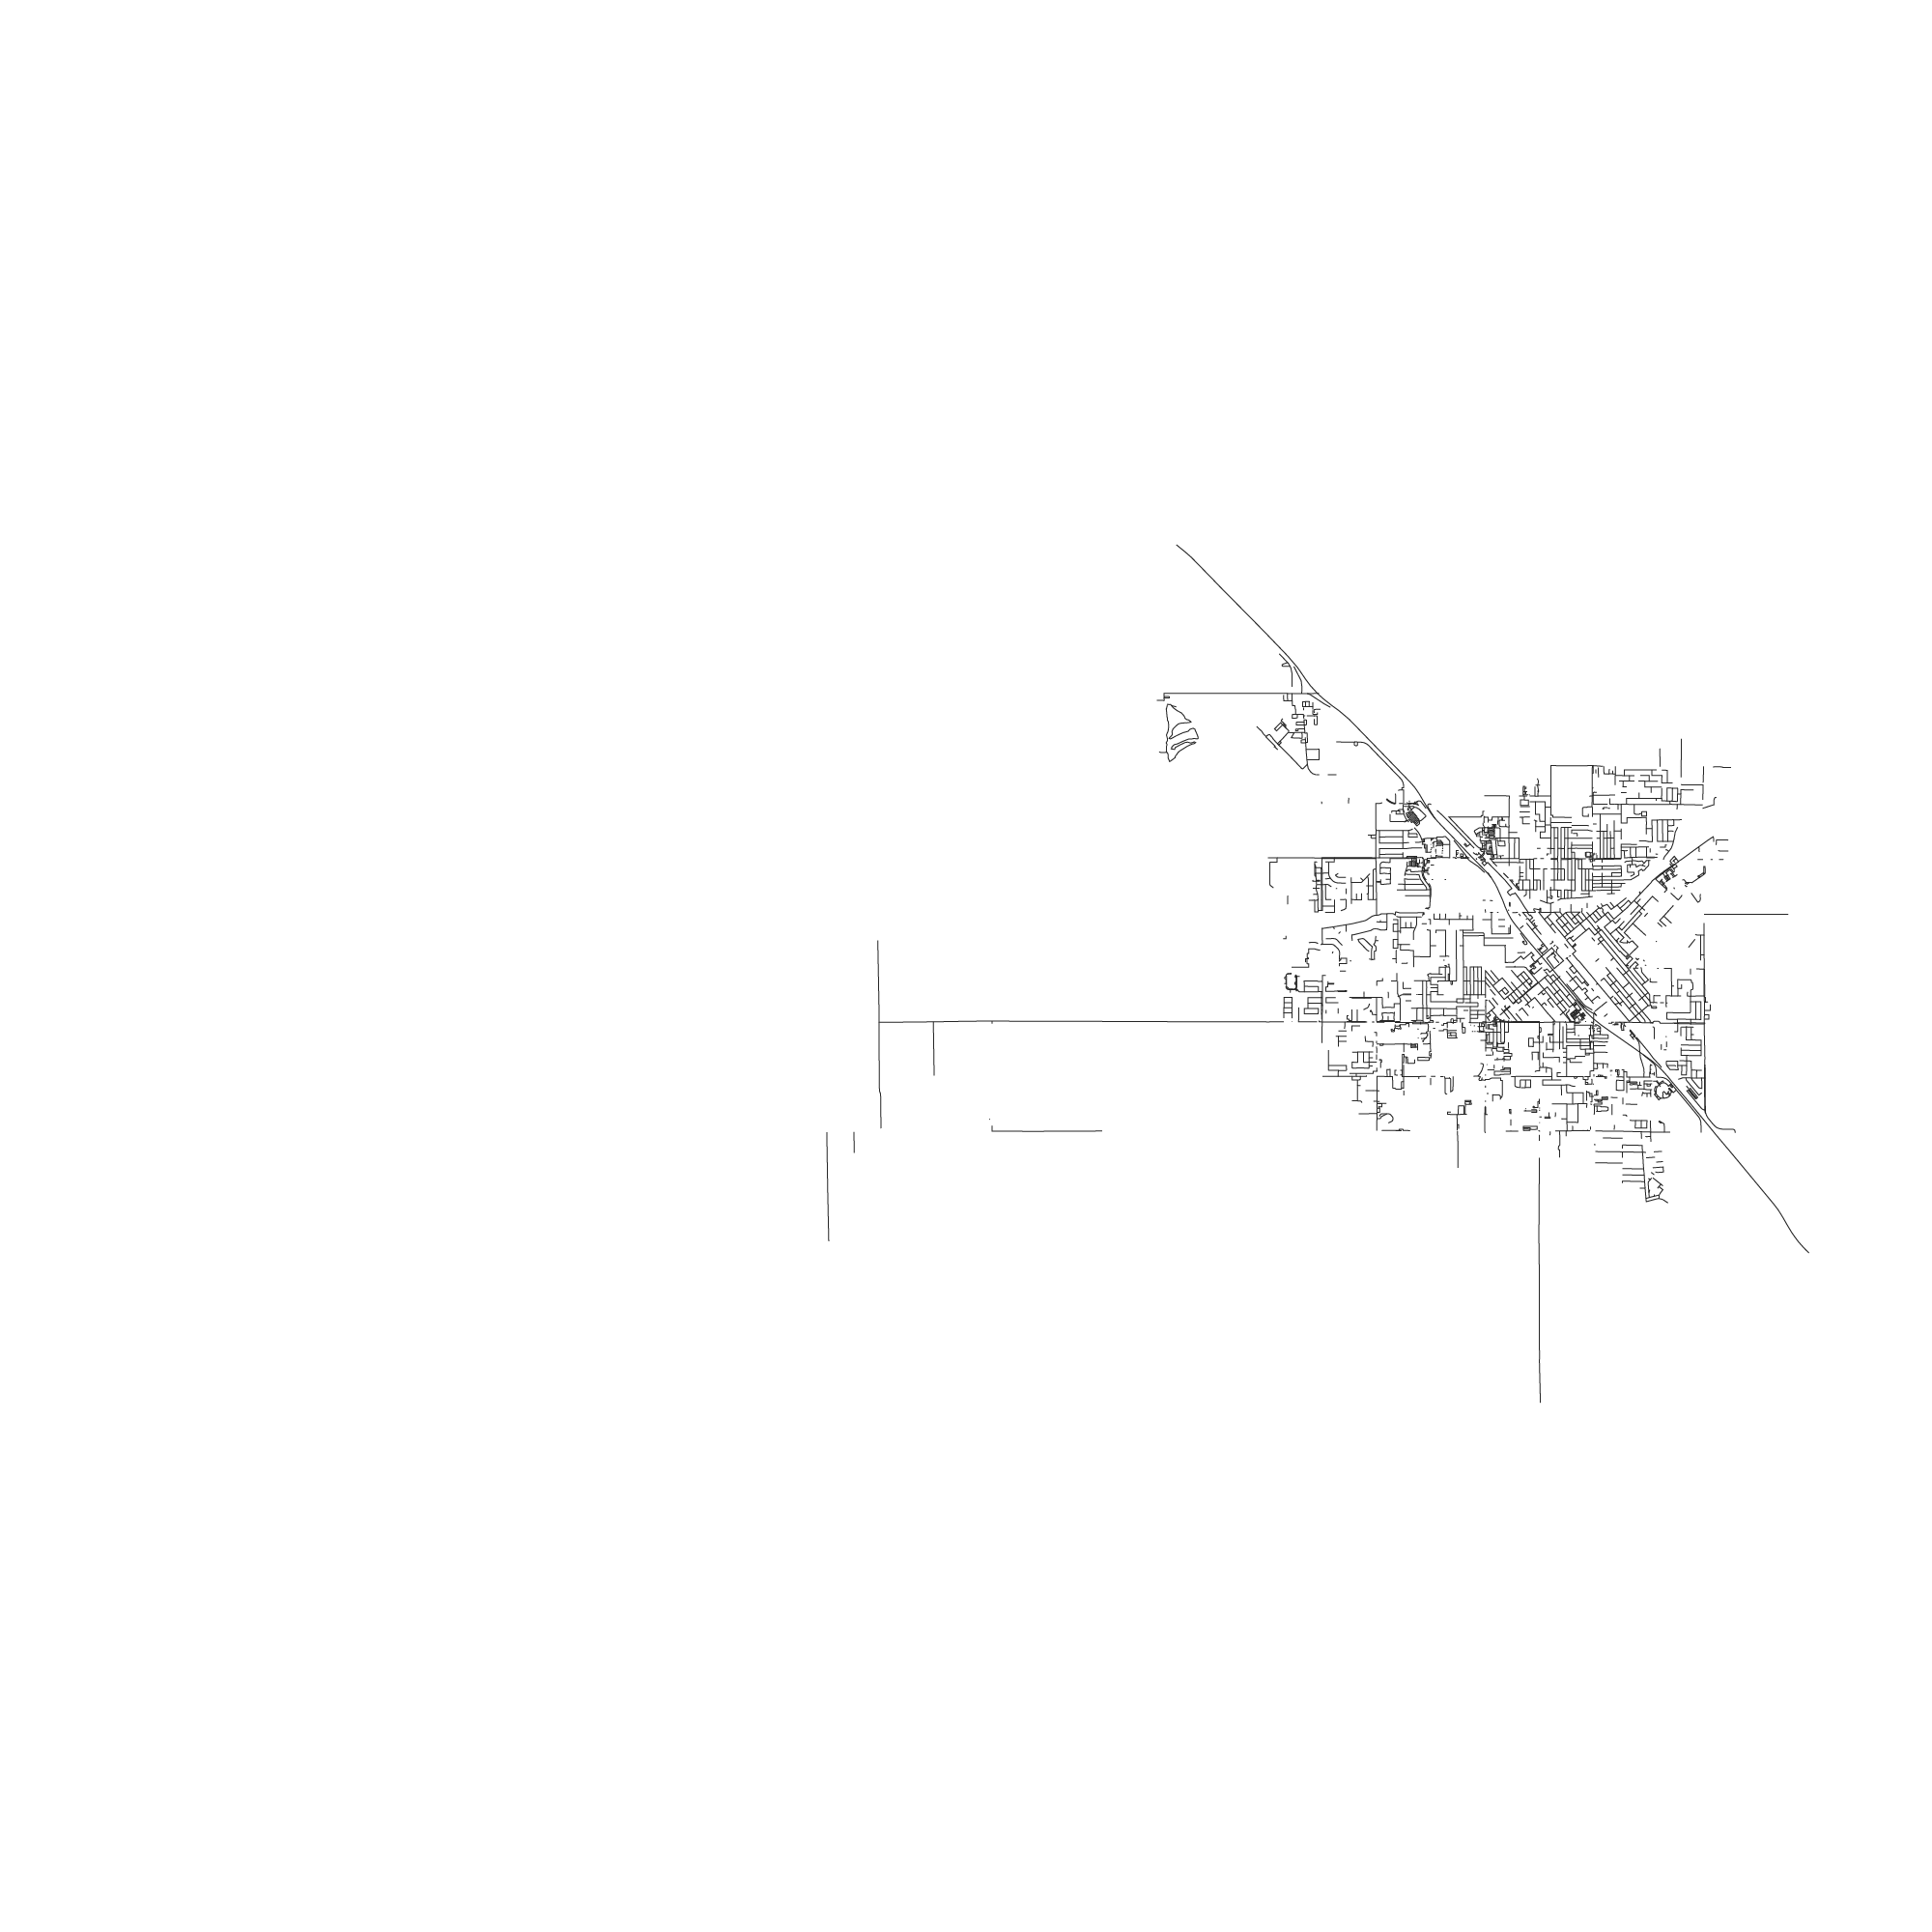
Madera, Calif.
My family migrated to Central California in the 1940s from the South. They worked as fieldhands in the region’s many fruit and nut orchards.
Madera, Calif. is where my grandparents met and where my mother was born. It’s a charming part of the state, but there weren’t many opportunities outside of farm work. I spent many summers here, helping my grandfather with crops in the backyard or learning my grandmother’s cooking recipes.
If I were born and raised here, assuming no changes in parental wealth, my expected income would be $19,000 (in 2015 dollars).
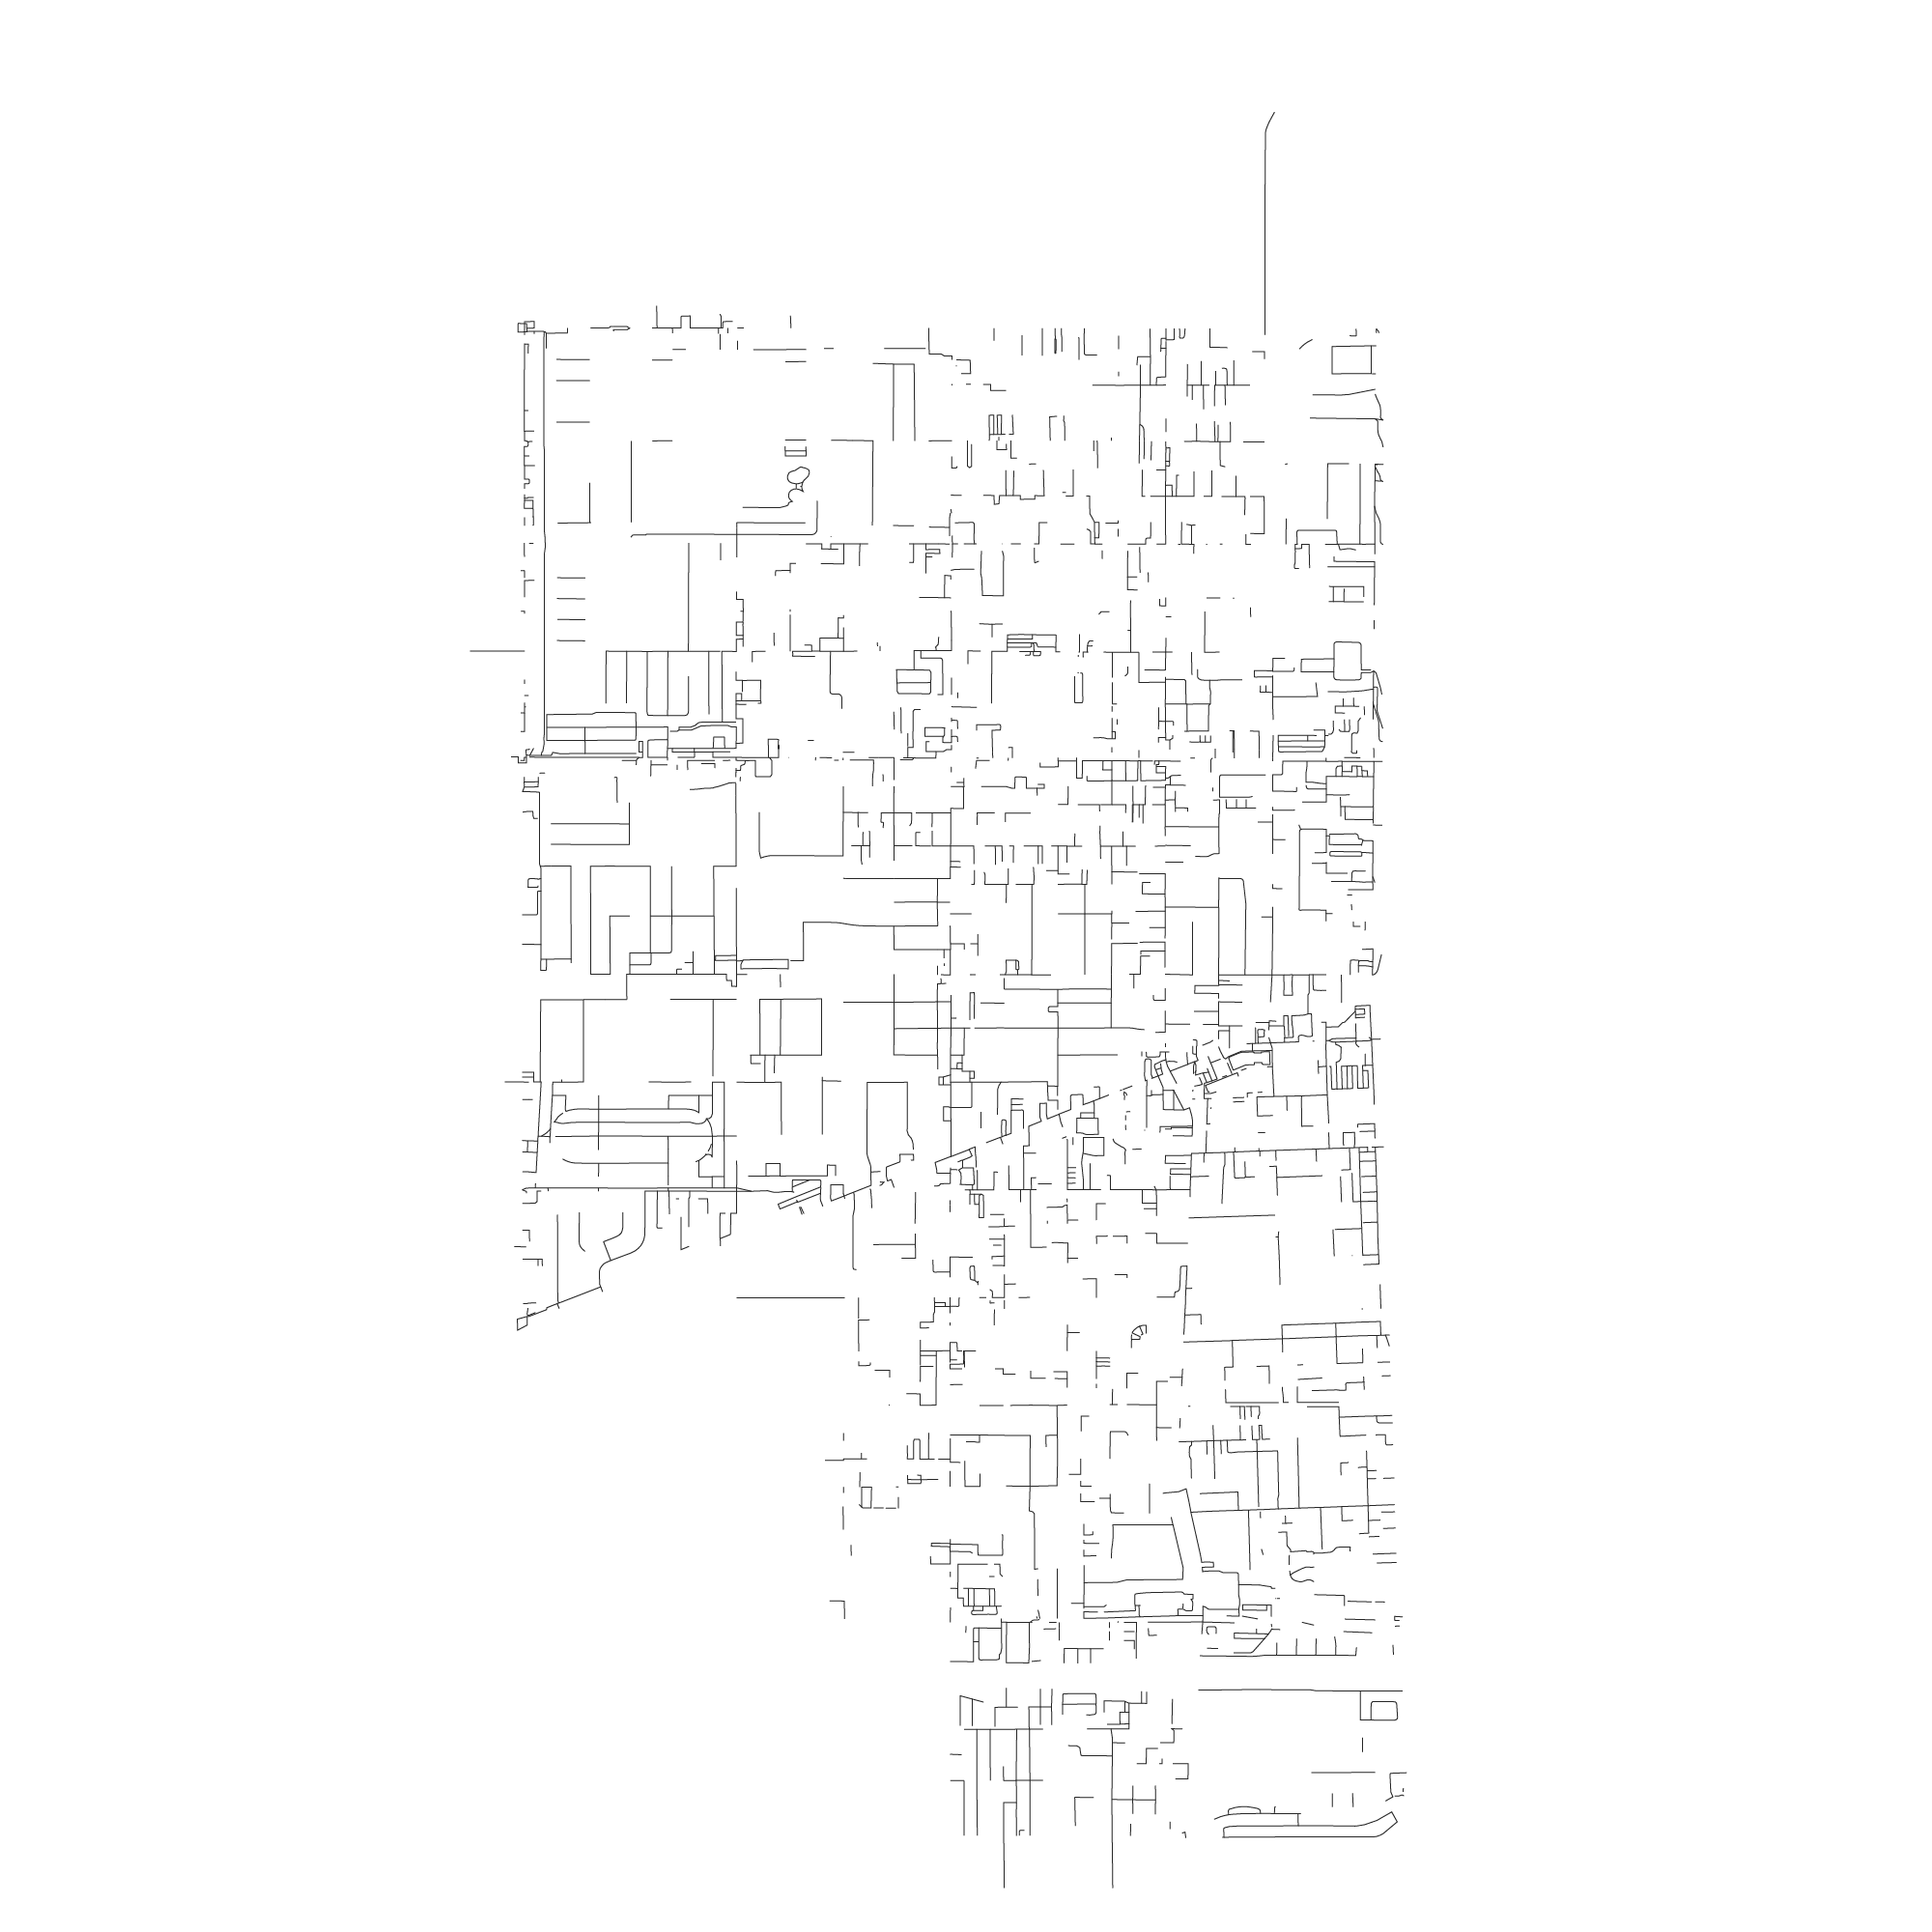
Gardena, Calif
In the 1960s, my grandparents moved to East Gardena, Calif. (a.k.a. West Rancho Dominguez or West Compton), about 15 miles south of downtown L.A. Most of my family is from here, and it’s where I was born.
Growing up, I knew two things to be true: almost everyone looked like me, and it was hard to breathe. My proximity to lousy air quality made breathing a chore, and my asthma didn’t help either. Hospital visits were typical back then. But it was home.
Assuming no changes in parental wealth, my expected income would be $38,000, 2x the predicted income from Madera.
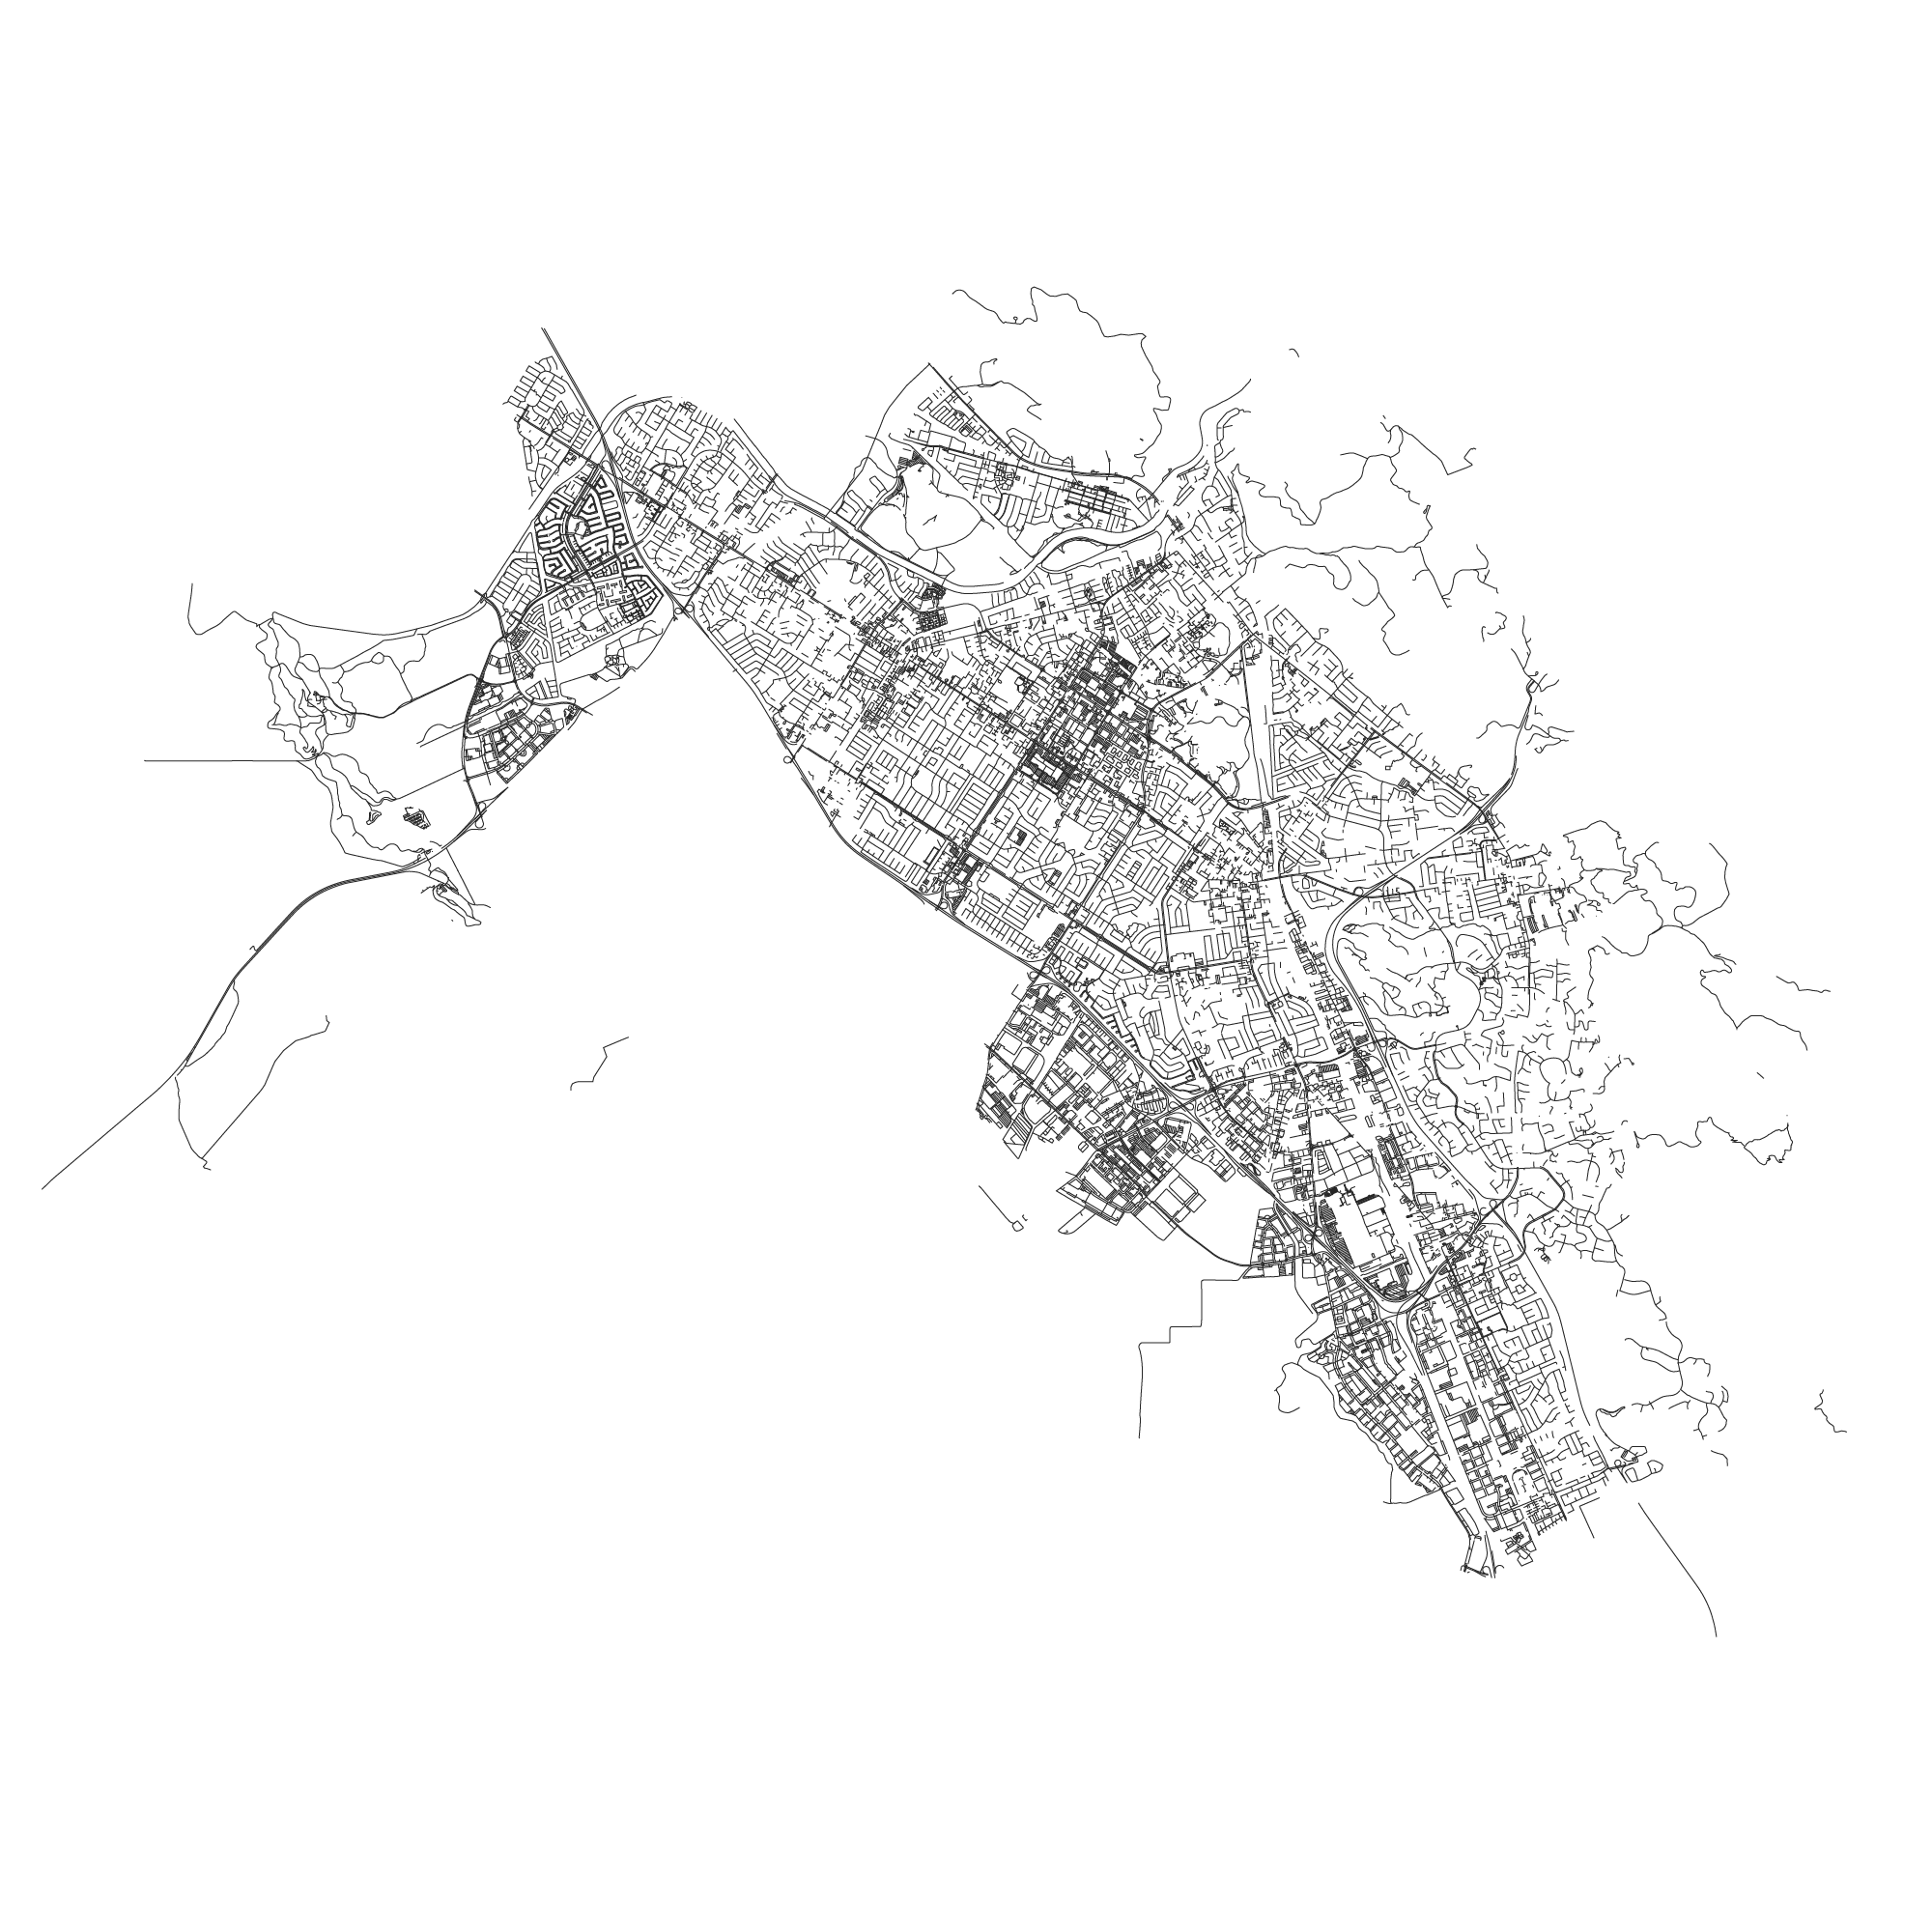
Fremont, Calif
In 1996, my mother took a leap of faith. Her job was closing their L.A. office, and they offered her two options: accept a layoff or relocate near the new hub in San Francisco. Tired of her life in L.A. and wanting to raise me in a better neighborhood, she moved us 373 miles north to the Bay Area suburb of Fremont, Calif.
The city is on the east end of the Dumbarton Bridge, which connects Fremont to Menlo Park, Calif., making it an ideal location because we had family nearby. Or, at least, we did until the high cost of living forced them to move back to the Central Valley. Fremont is where I first experienced the isolation of being one of the few Black folks in my city. But, it was, is, home.
Expected income: My expected income by 35 became $49,000, a 2.5x increase from Madera and a 0.4x increase from Gardena.
Madera, Gardena, Fremont. Three different cities. Three different financial outcomes for Black kids.
The desire to move somewhere else for opportunities is common. When my grandparents moved from the South to California in the 1940s, they were part of one of the largest migrations in American history.
Migration
The Great Migration is a story of holding the American Dream to its word.
From 1910 to 1970, millions of Black folk across the American South would leave searching for new opportunities, hoping their futures would be brighter and not haunted by the oppressive regimes in their hometowns.
The First Great Migration
Percent change in Black population by city from 1910 to 1940
Lower
Higher
Source: U.S. Census
This desire didn’t stop once my family got to California, though. My family migrated out of the California farm country for better opportunities.
Some went north to the Bay Area, settling primarily in Menlo Park and East Palo Alto.
My mother’s family was part of the cohort that went south to Los Angeles, settling primarily in L.A.’s Crenshaw district and farther south in Compton and Gardena.
In Gardena, my family and I lived on a classic American culdesac with modest single-family houses and manicured lawns. It was one of those blocks occupied by the same families for generations where everyone raised each other’s kids.
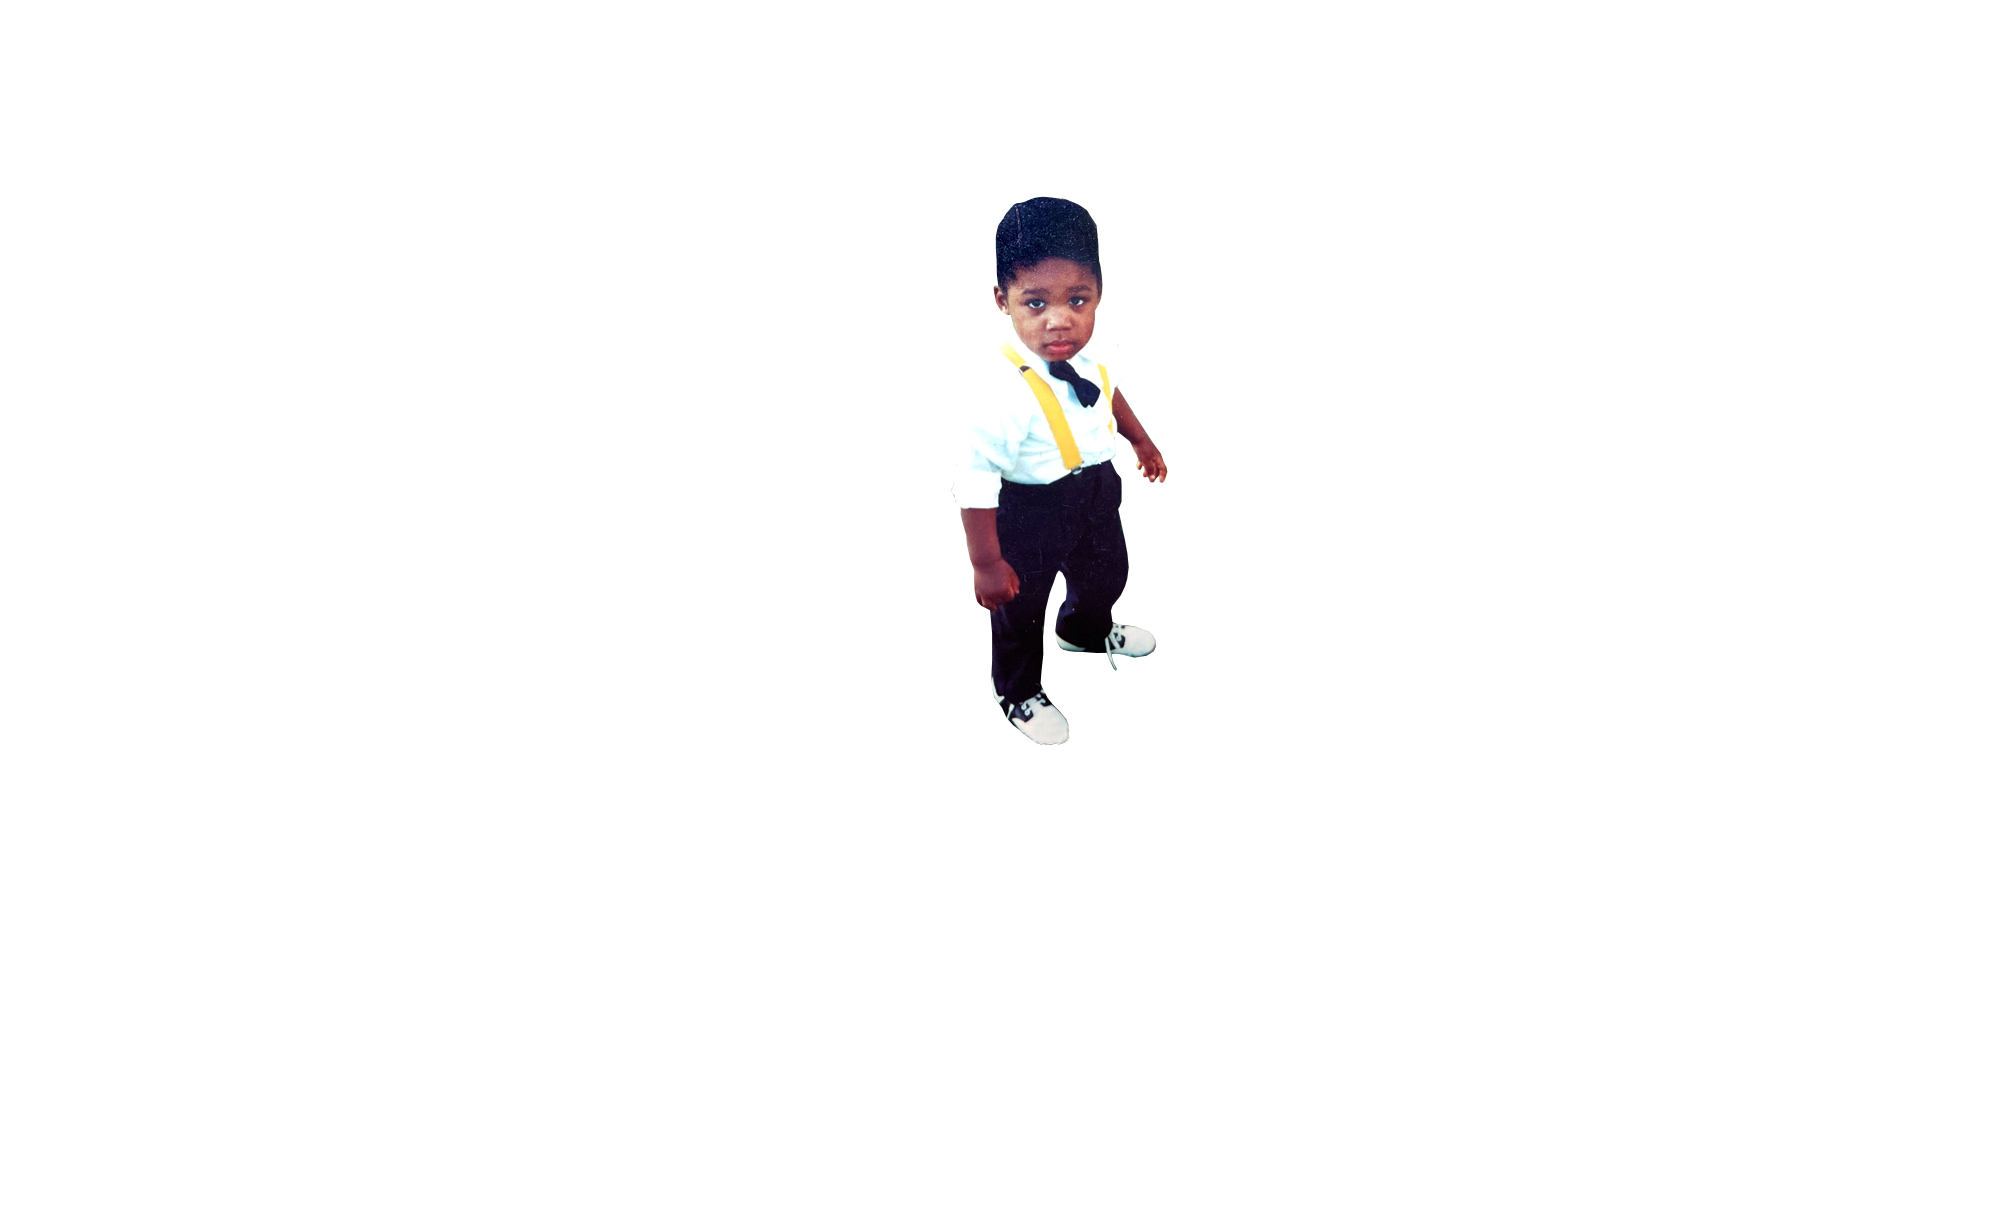
Top: My grandparents with my mother as a baby in Madera, Calif. circa 1960’s; Center: My grandparents with my teenage mother in Los Angeles in the ‘70s; Bottom: My mother holding me as a child in Gardena, Calif. in the early ‘90s.
We left the generational familiarity of Gardena for a two-bedroom apartment in Fremont.
As I found earlier, my expected income increased from $38,000 to $49,000 once we moved to Fremont. What other “opportunities” emerged?
Upward Mobility
Gardena
48%
Share of Black kids in neighborhood
42%
Share of Black kids who stayed in neighborhood as adults
$81k (84th percentile)
Median Household Income in 1990
$40k (28th percentile)
Median Household Income in 2016
Fremont
4%
Share of Black kids in neighborhood
<5%
Share of Black kids who stayed in neighborhood as adults
$84k (86th percentile)
Median Household Income in 1990
$120k (96th percentile)
Median Household Income in 2016
What if?
Who would I be had we stayed in Gardena? By some economic measures, I’d be worse off. But I don’t find it surprising that life brought me back to where I started.
The data above is only part of what makes someone’s life. These estimates offer interesting starting places for exploration but don’t tell the whole story.
Fremont offered so much for those years. I met many lifelong friends there. And, by other measures, I received a better education and opportunities. Who knows if I’d be able to write (and code) an essay for The Pudding had I not grown in the dual arts and tech world of Silicon Valley?
I guess I always felt like my story in L.A. wasn’t finished. It’s odd being from somewhere and not at the same time. Leaving L.A. meant leaving our community. Over the years, I built roots in the Bay that extended beyond those my family made. I did the same in Washington, D.C.
But, being closer to my family (including my mother, who also recently moved back to Southern California) has reminded me of the importance of being close to those you love.
Toward the end of the summer, my mom, aunt, uncle and I went back to Gardena. It was the first time we had all been there in probably over a decade.
About this story
- Outcome and neighborhood U.S. census data comes from the Opportunity Atlas project. Estimates based on Census estimates from 2012-2016 and decennial census figures from 1990, 2000 and 2010.
- Great migration data comes from the U.S. Census.
- Visual inspiration comes from W.E.B. Du Bois's infographics in Data Portraits: Visualizing Black America.
- Archival photos courtesy of the Brown/Williams family.