

Our Resources
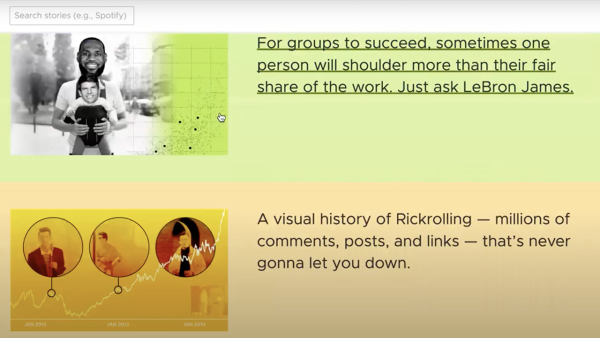
Although we primarily publish visual essays here at The Pudding, we also produce resources for the data journalism and visualization communities.


FAQ
What tools do you use?
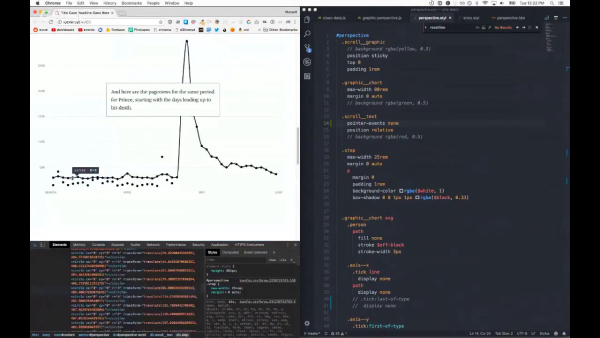
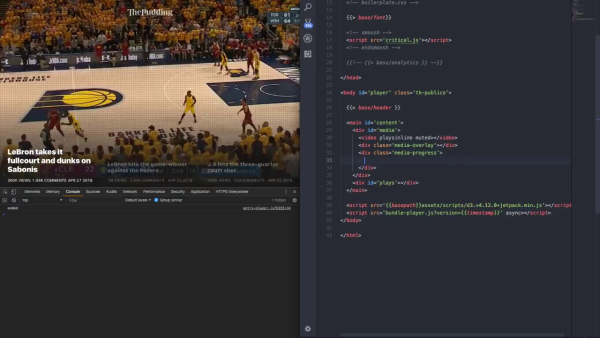
This is a multi-part question. Typically, when people ask this, they are asking about the visualization that lives on the internet inside of our stories. Those visuals are most often coded by our team using front-end web languages (HTML, CSS, JavaScript). We often rely heavily on the D3.js JavaScript library and Svelte, a component-based framework.
Some of our static/non-interactive graphics are created using other tools like R, Figma, or Flourish. For interactive maps, we frequently use Mapbox.
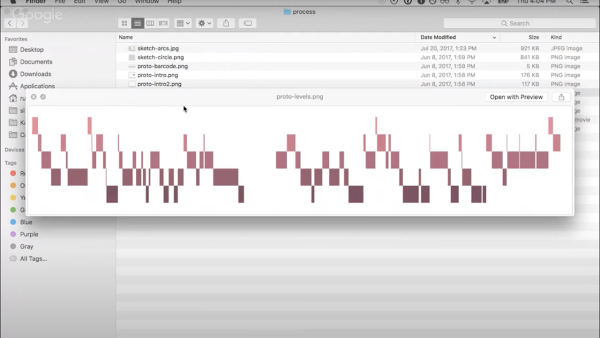
But before we can create a visualization on the internet, there’s lots of data acquisition, cleaning, and general design involved. You can learn more about our process for those things here, here, or here.
What other JavaScript libraries do you use?
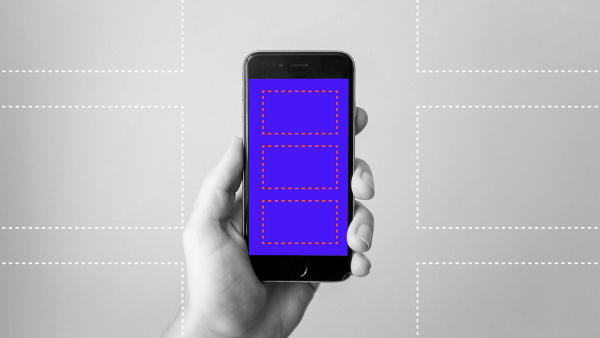
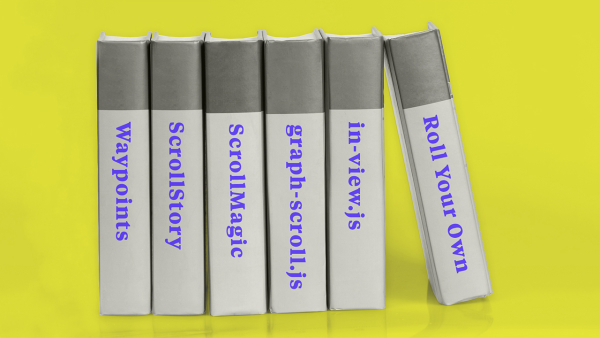
scrollama for scrollytelling
scrollmagic also for scrollytelling
enter-view to detect when elements enter the screen
d3-annotation for annotations in D3.js
moveto for scrolling to DOM elements
noUiSlider for cross-browser range sliders
lodash for general JS utilities
What skills do you recommend I learn to do what you do?
The answer to this question will vary depending on who you ask. For us, we always recommend that people learn how to solve problems (and fail at things) since that’s a huge part of our daily work. It’s also important to be curious about the world.
As far as technical skills go, we’ve found that it’s more important for you to find tools that you are comfortable with and can use well rather than trying to learn any (or all) specific programming languages. You’ll need to know how to find or collect data, clean messy data, and make accurate data interpretations before you worry too much about making fancy data visualizations. We typically use and recommend R, Python, SQL or Node.js for data collection and processing work. You can find more about our data process here.
Once you’ve got those skills down in your language of choice, having a good understanding of basic design principles and human perception of data visualization becomes important. Again, we use a wide variety of tools to create our story designs (everything from Google Docs and hand-drawn sketches to software like Figma or Adobe Illustrator). You can find more information about our design process here.
Then you can work on bringing those designs online. If your hope is to create interactive graphics for the internet, you will need to learn HTML, CSS, and JavaScript. We often use D3.js, a JavaScript library, but we recommend understanding the fundamentals of web development before trying to pick it up. Many forms of data visualization can be created without the use of D3.
What is your process for writing a data story?
You can find our process in its entirety here. In short, we each keep a backlog of story ideas (you can find our public one here) and then routinely pitch those ideas to the rest of the team. Our story ideas tend to take the form of a question that we will then attempt to answer using data. The team provides feedback and then the author can decide which idea(s) to pursue.
They then find/collect/analyze data, determine whether they have successfully answered their driving question (or if they should change course to a different question). See how that flow works here. Once the data has been analyzed, the author creates a storyboard of how they imagine the story to go with any graphics needed to help the reader understand the topic at hand. Read more about how we think about storytelling here. Last, the story is coded out and put on the internet.
How long do projects take?
Our projects usually take anywhere from a few weeks to a few months to complete.
Do you release your data or code?
Yup! Whenever possible, we release our data and data analysis scripts in a GitHub repo for public use.
We also have a public GitHub repo for our front-end builds.